Click here to go to this project on GitHub
Previously, I created a system for testing batteries using an MDL-BDC24 “Black Jaguar” motor controller. In that project, I used the motor controller for all the hardware interfacing: voltage sensing, current sensing, and switching. Then, I used the BDC-COMM Windows application in command-line interface mode as a middleman to talk to the Jag over RS-232. This was quite a hassle and produced rather ugly, inaccurate results.
This new project uses a custom circuit to do the switching and monitoring, adding features such as 4-wire sensing by measuring battery voltage directly on the SB50 connector. Instead of relying on the difficult software chain to interface with the Jag, this just uses an Arduino Nano-compatible microcontroller connecting to a similar Java UI using the jSerialComm library.
As a quick summary, the purpose of this project is to characterize battery performance (specifically 12V 18Ah SLA batteries used in the FIRST Robotics Competition) through controlled discharge. This project applies a constant-resistance high-power (about 35A) load across the battery and records its voltage, current, power, and total delta energy (watt-hours) until the battery voltage drops down to a minimum cutoff.
Disclaimers
Seventeen Acres Battery Test V2 is, in general, licensed under the MIT license. However, it includes an unmodified JAR of the jSerialComm library from Fazecast which is released under the Apache license V2.0.
USE THIS SOFTWARE AND GUIDE AT YOUR OWN RISK. This software is not designed for and does not have adequate safety mechanisms for use with actuators, precision applications, safety-critical applications, or industrial use. Use this software for testing in a non-production environment only. Do not use this software or setup described unsupervised. Even use with a resistive load, as described below, can cause damage, injury, fire, or death. This software is in a rough state and may malfunction.
Thanks to FRC team 548, the Robostangs for supporting this project. They had no involvement with this publication and any views or statements presented in this article are my own.
Hardware
Fittingly, the hardware setup requirements for this version are more complex than the original. The basic components required are listed below.
- Control circuit (described in detail below)
- Mini USB cable
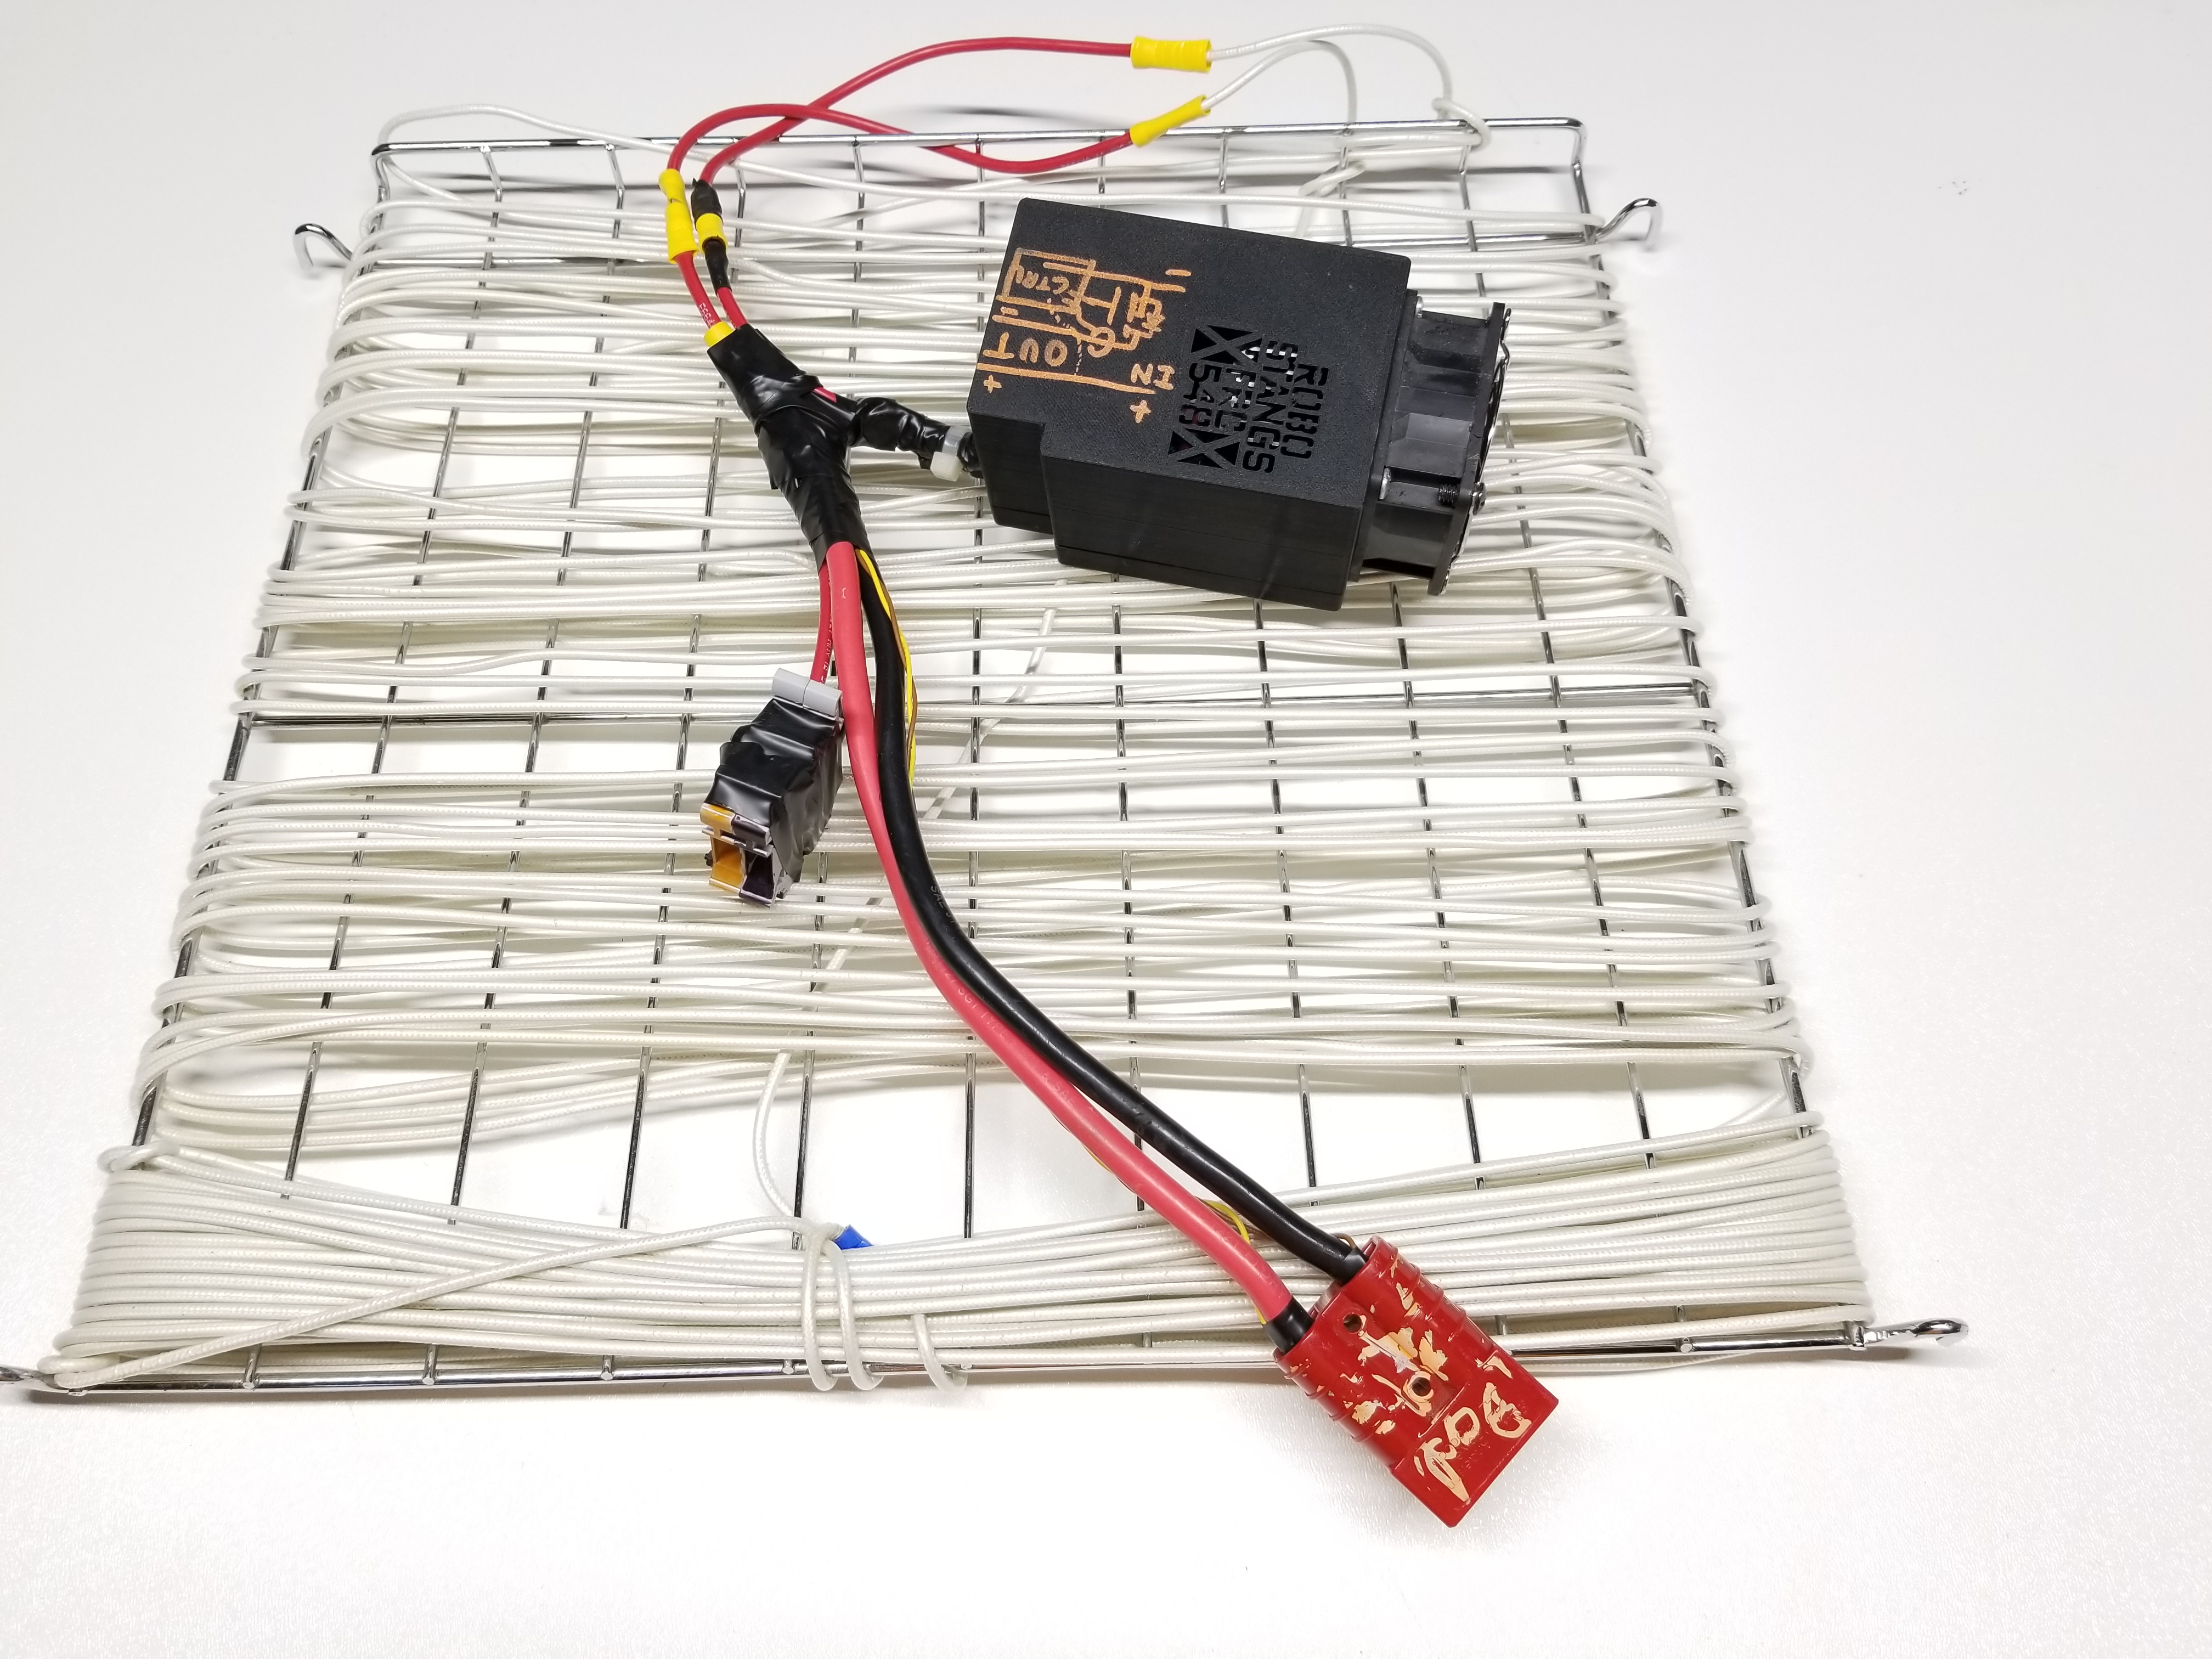
- Insulated steel wire load (possibly cooled with a box fan)
- Windows PC
Control Circuit Design
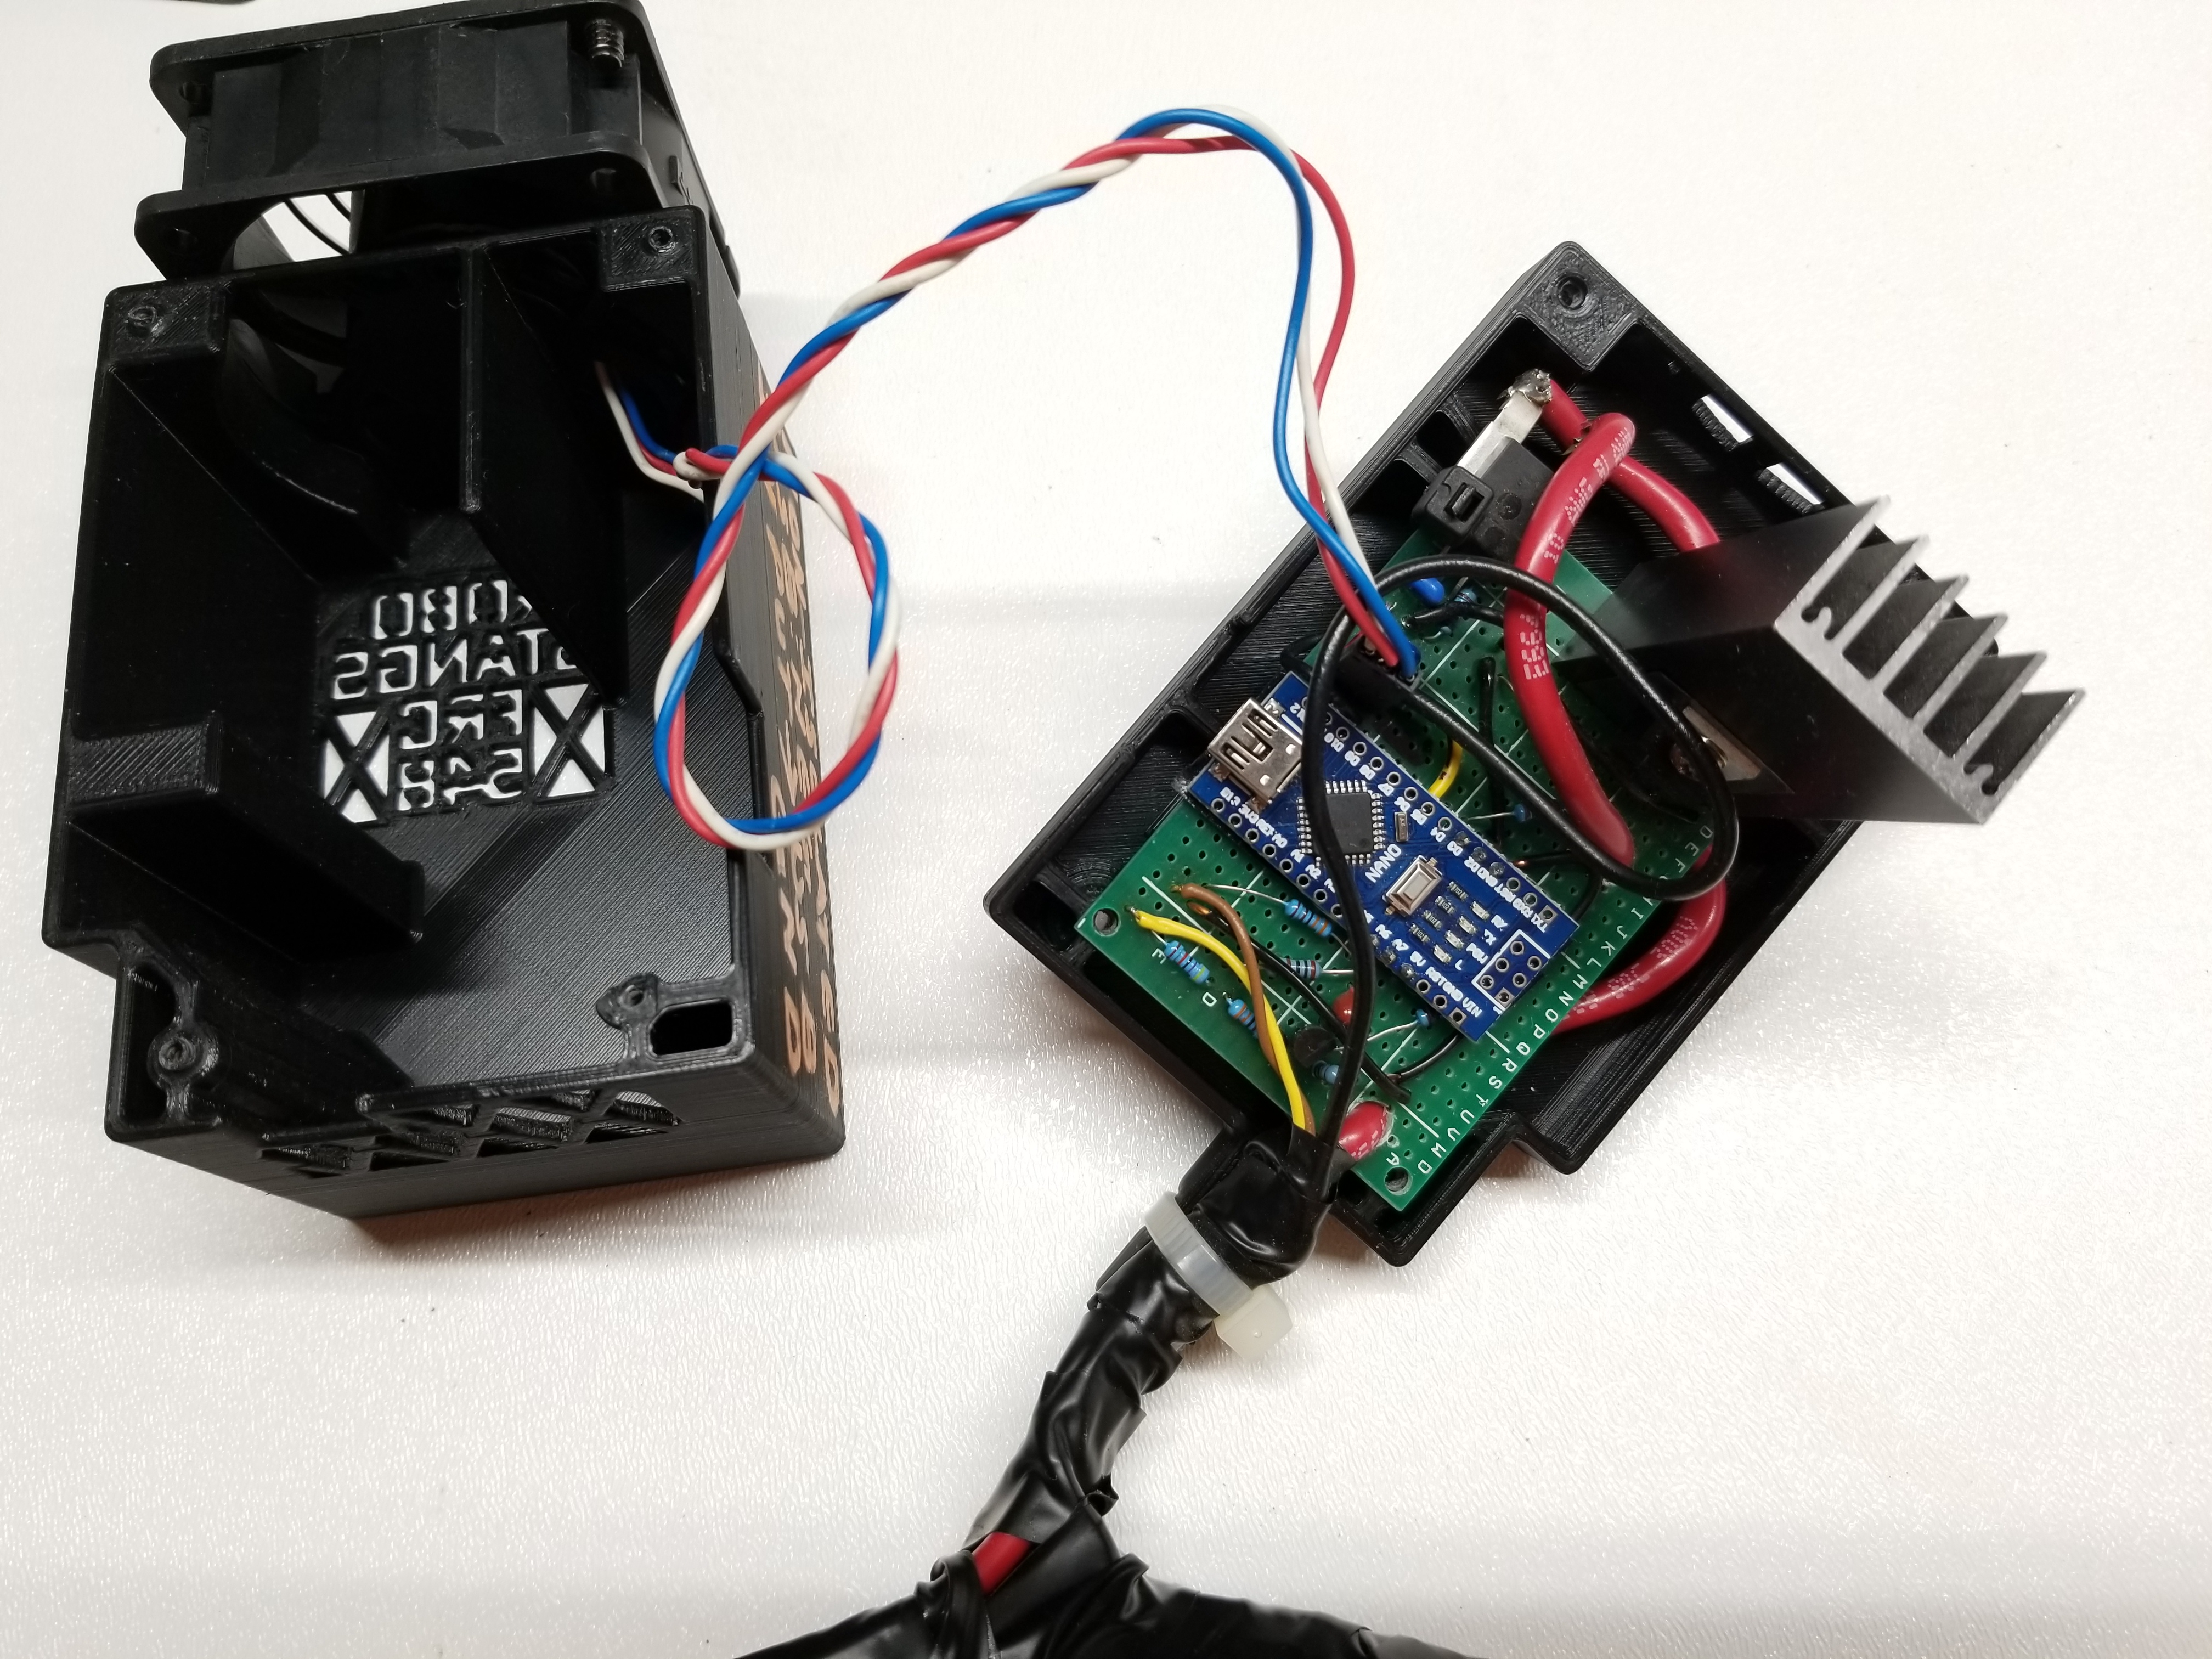
The control box (and its attached wiring) incorporates voltage sensing, current sensing, and load switching. The overall schematic and assembled board for everything is shown below. Connections to the microcontroller are shown in red. Some details (like the exact routing of the ground path) might not be exactly accurate since I put this project together a couple years ago.

Voltage Sensing
Voltage sensing is accomplished by a simple voltage divider and a lowpass filter. This lowpass filter can be disabled by the microcontroller using a small signal transistor to enable high-speed operations like pulsed-load internal resistance measurement, but that feature is not used so the enable signal is hard-coded high.
Current Sensing
Current sensing is done by an Allegro ACS755xCB-050 Hall effect current sensor IC with a simple lowpass filter on its output.
Switching
Load switching is done by an IRLB8314 cooled by a heatsink with fan. This is likely overkill for the current use case where there is no PWM being used so this FET just turns on once and stays on for the entire test. The aggressive cooling system may be required if PWM is used, since that increases the time the FET spends turning on and off.
Control
These components are controlled and monitored by the the Arduino Nano-compatible microcontroller. To ensure resilience to USB power supply voltage variation, the internal 1.1V analog reference is used. However, the current sensor may still have some sensitivity to supply voltage so it may be wise to calibrate and use the system on a single computer in a single configuration (one laptop I have produces significantly different USB voltages if it is plugged in or not). In an attempt to fix this, the zero-current-offset is set automatically on power up and the measurement is converted to engineering units by a conversion factor relating the fractional change of the observed current signal to the zero-offset value (since I believe the current sensor outputs fractional to its supply voltage not absolute).
At 10Hz, if the load is set to be enabled, the PC software sends OPENLOOP to the microcontroller. The microcontroller checks for this signal every 10ms and disables the load if it is not heard for 300ms. Each time it checks for the enable signal, the microcontroller reads the voltage and current sense voltages and sends them over serial to the PC software.
Interfacing
The original BattTest only supported the wire-rack load and had poor connection to the battery terminals. This version supports the standard SB50 connector used on the batteries used in FRC robots and also supports connection to other sources through the two DIN-rail terminal blocks attached in parallel to the SB50. In this configuration, 4-wire sensing is lost, but it provides a much simpler interface to random other devices. Also, simple adapters were made to adapt the output to any random load as well, as shown below:
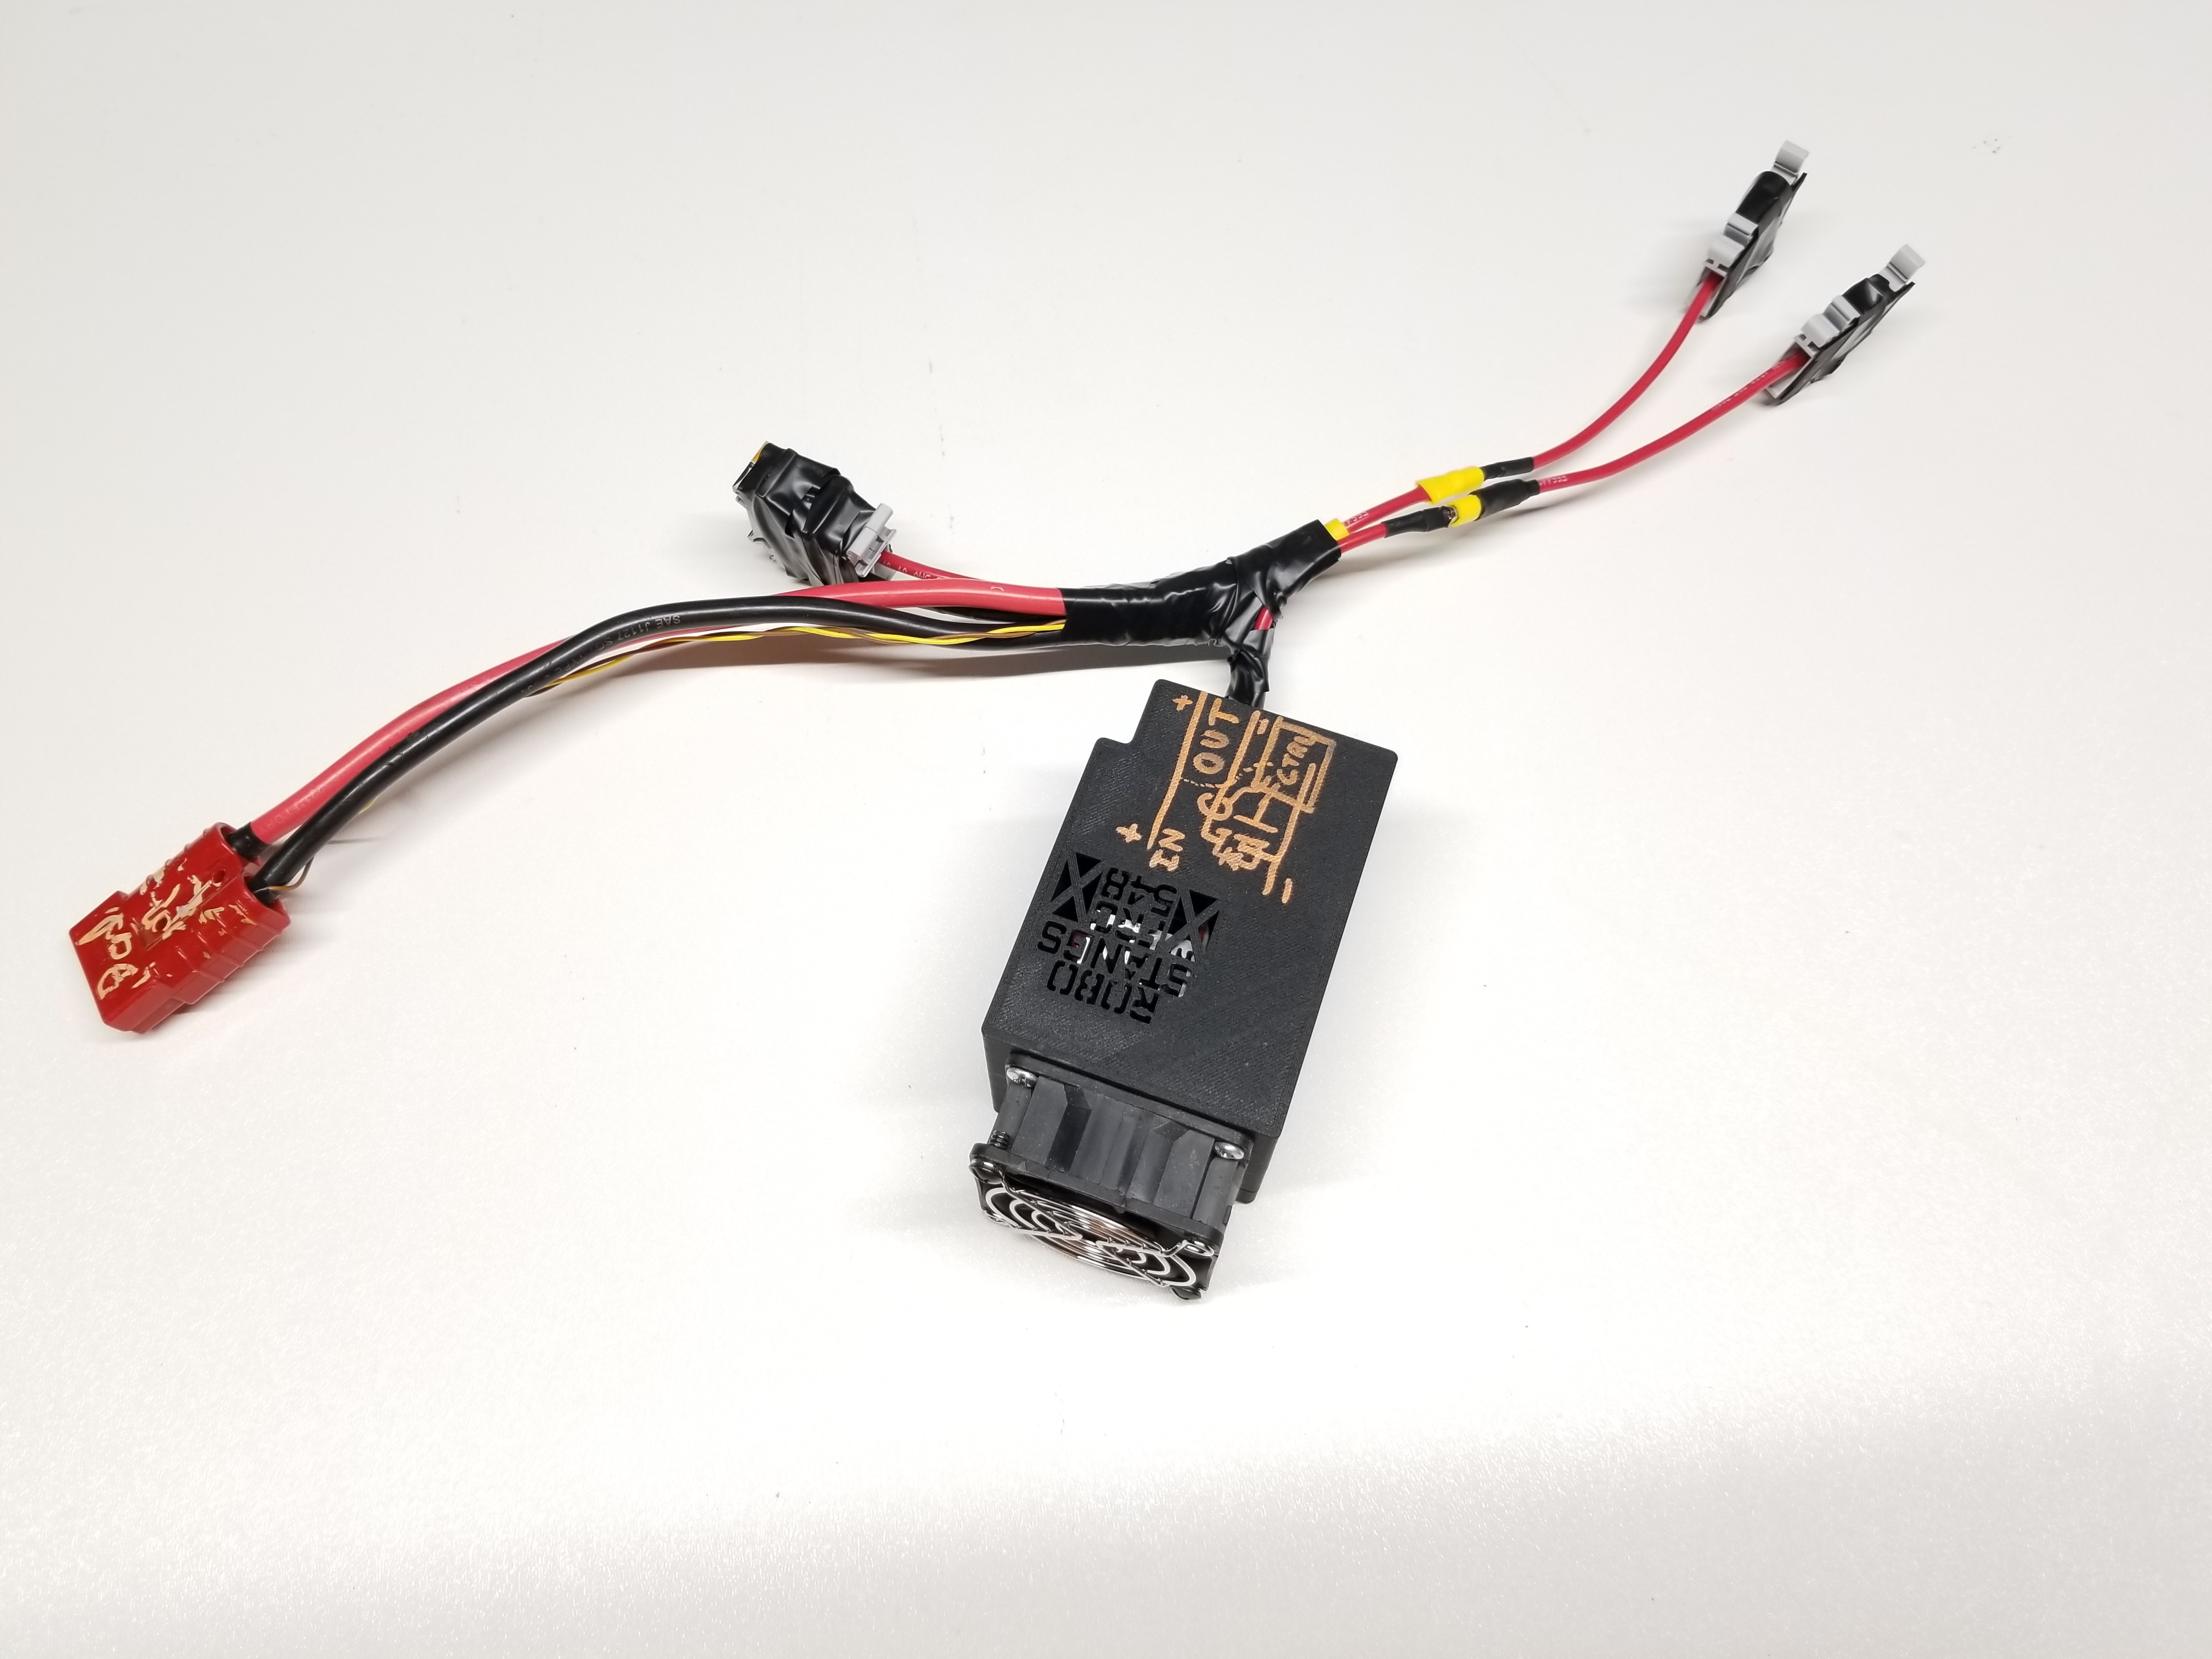
The box connects to the control PC using a normal mini USB cable. It is important to note that the ground of this USB connector is connected to the ground of the battery, so be careful when using this with mains-referenced power supplies and mains-referenced computers.
Software
The PC-side software is generally similar to V1 but simpler since it does not provide any constant-current or cyclic modes. Basically, it runs a few timed loops to read the measurement value messages from the microcontroller (recording the data to the PC in CSV form) and sends messages to the microcontroller to instruct it to turn on. Then, (if enabled) the load will turn off if the measured voltage is below a certain threshold. This is accompanied by a beep and the exiting of the program.
Prerequisites
- PC (tested on Windows 10). Linux operation may be possible with some modification but the Arduino interface expects a port named “COMx”
- Java 8 runtime
- BatteryTest2.x JAR downloaded from GitHub
- BattTest2Duino software installed on the microcontroller in the control box
Use
- Connect the load and battery to the tester.
- Connect the microcontroller to the computer.
- Note the COM port connected to the USB-serial interface on the microcontroller using Device Manager.
- Prepare for the load output to energize.
- Open the Battery Test jar and enter the appropriate COM port number (just the number like
3notCOM3). Note: On some Java installations, you will need to open a command prompt window in the location of Battery Test and run the following command:java -jar "BatteryTest2.x.jar". - Enter a name for the test. This will begin communication with the microcontroller and start logging data to
%USERPROFILE%\Desktop\BattTest\{BATTERY_NAME} Batt Test{ISO-8601_DATE_TIME}.csv. - Set the cutoff voltage to a reasonable value (default: 8.5V) or un-check the checkbox.
- Click “Start Test”.
- Wait for the test to complete as indicated by a beep and a popup window indicating the total energy extracted from the battery.
- Acknowledge the completion of the test, resulting in the application closing.
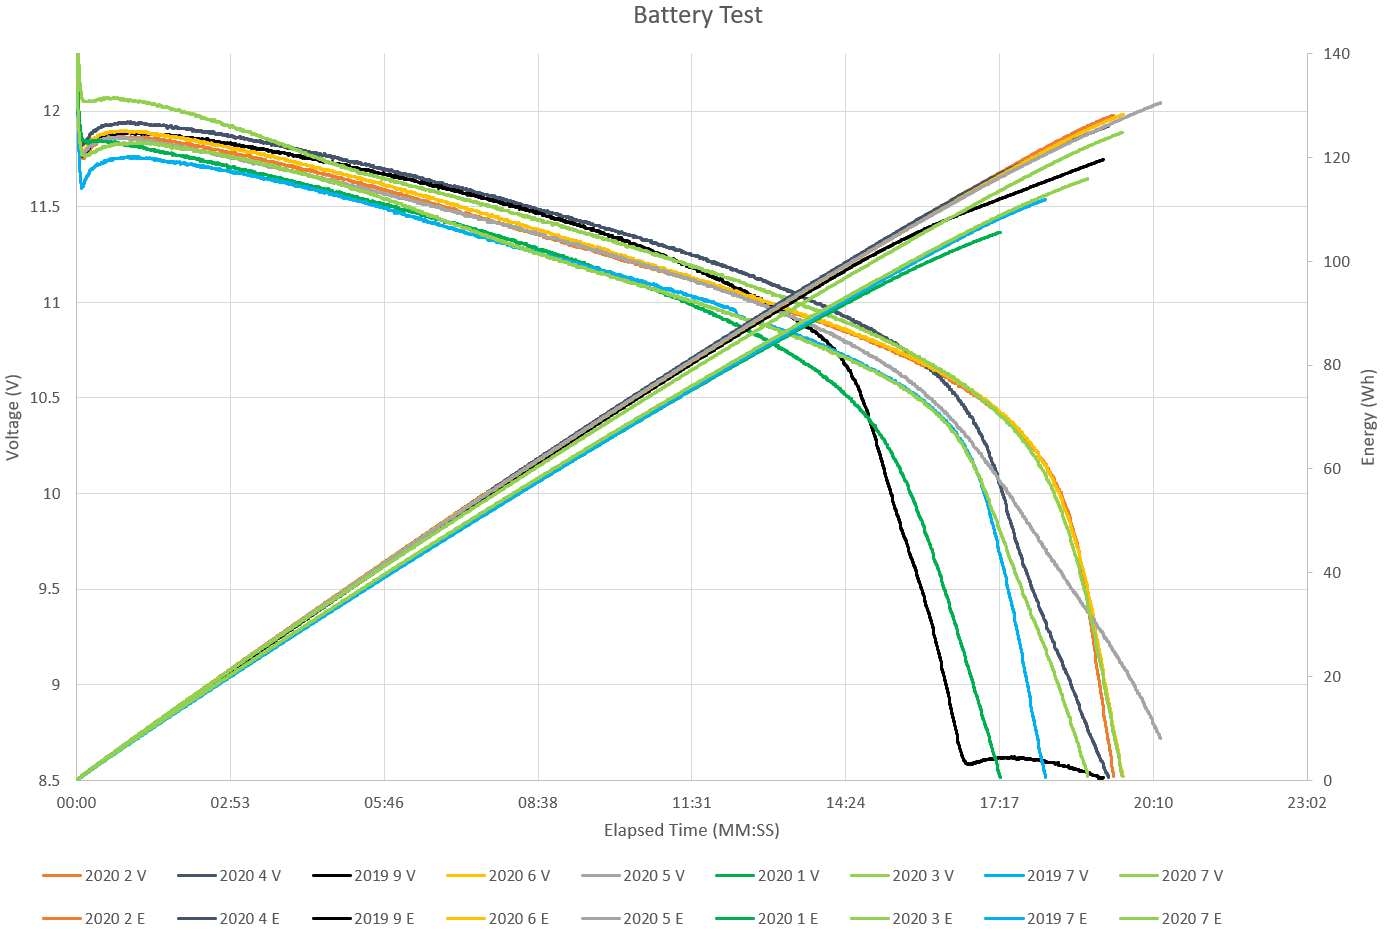
Results
The output produced by this generation of the system is much smoother and lacks visible stair-steps, indicating much better measurement performance. The results from testing several (I believe, it was a while ago) Battery Mart SLA-12V18 packs is shown below. In general, the batteries supplied 50-60% of their rated capacity in this test before reaching the cutoff. One interesting property explored for some batteries was the relationship between the total energy output and the average power output for the first part of the discharge curve. This latter statistic may be more important since, in an FRC match, only maybe half of the battery capacity is used since it is only around 2 minutes long.